

Drawn to scale
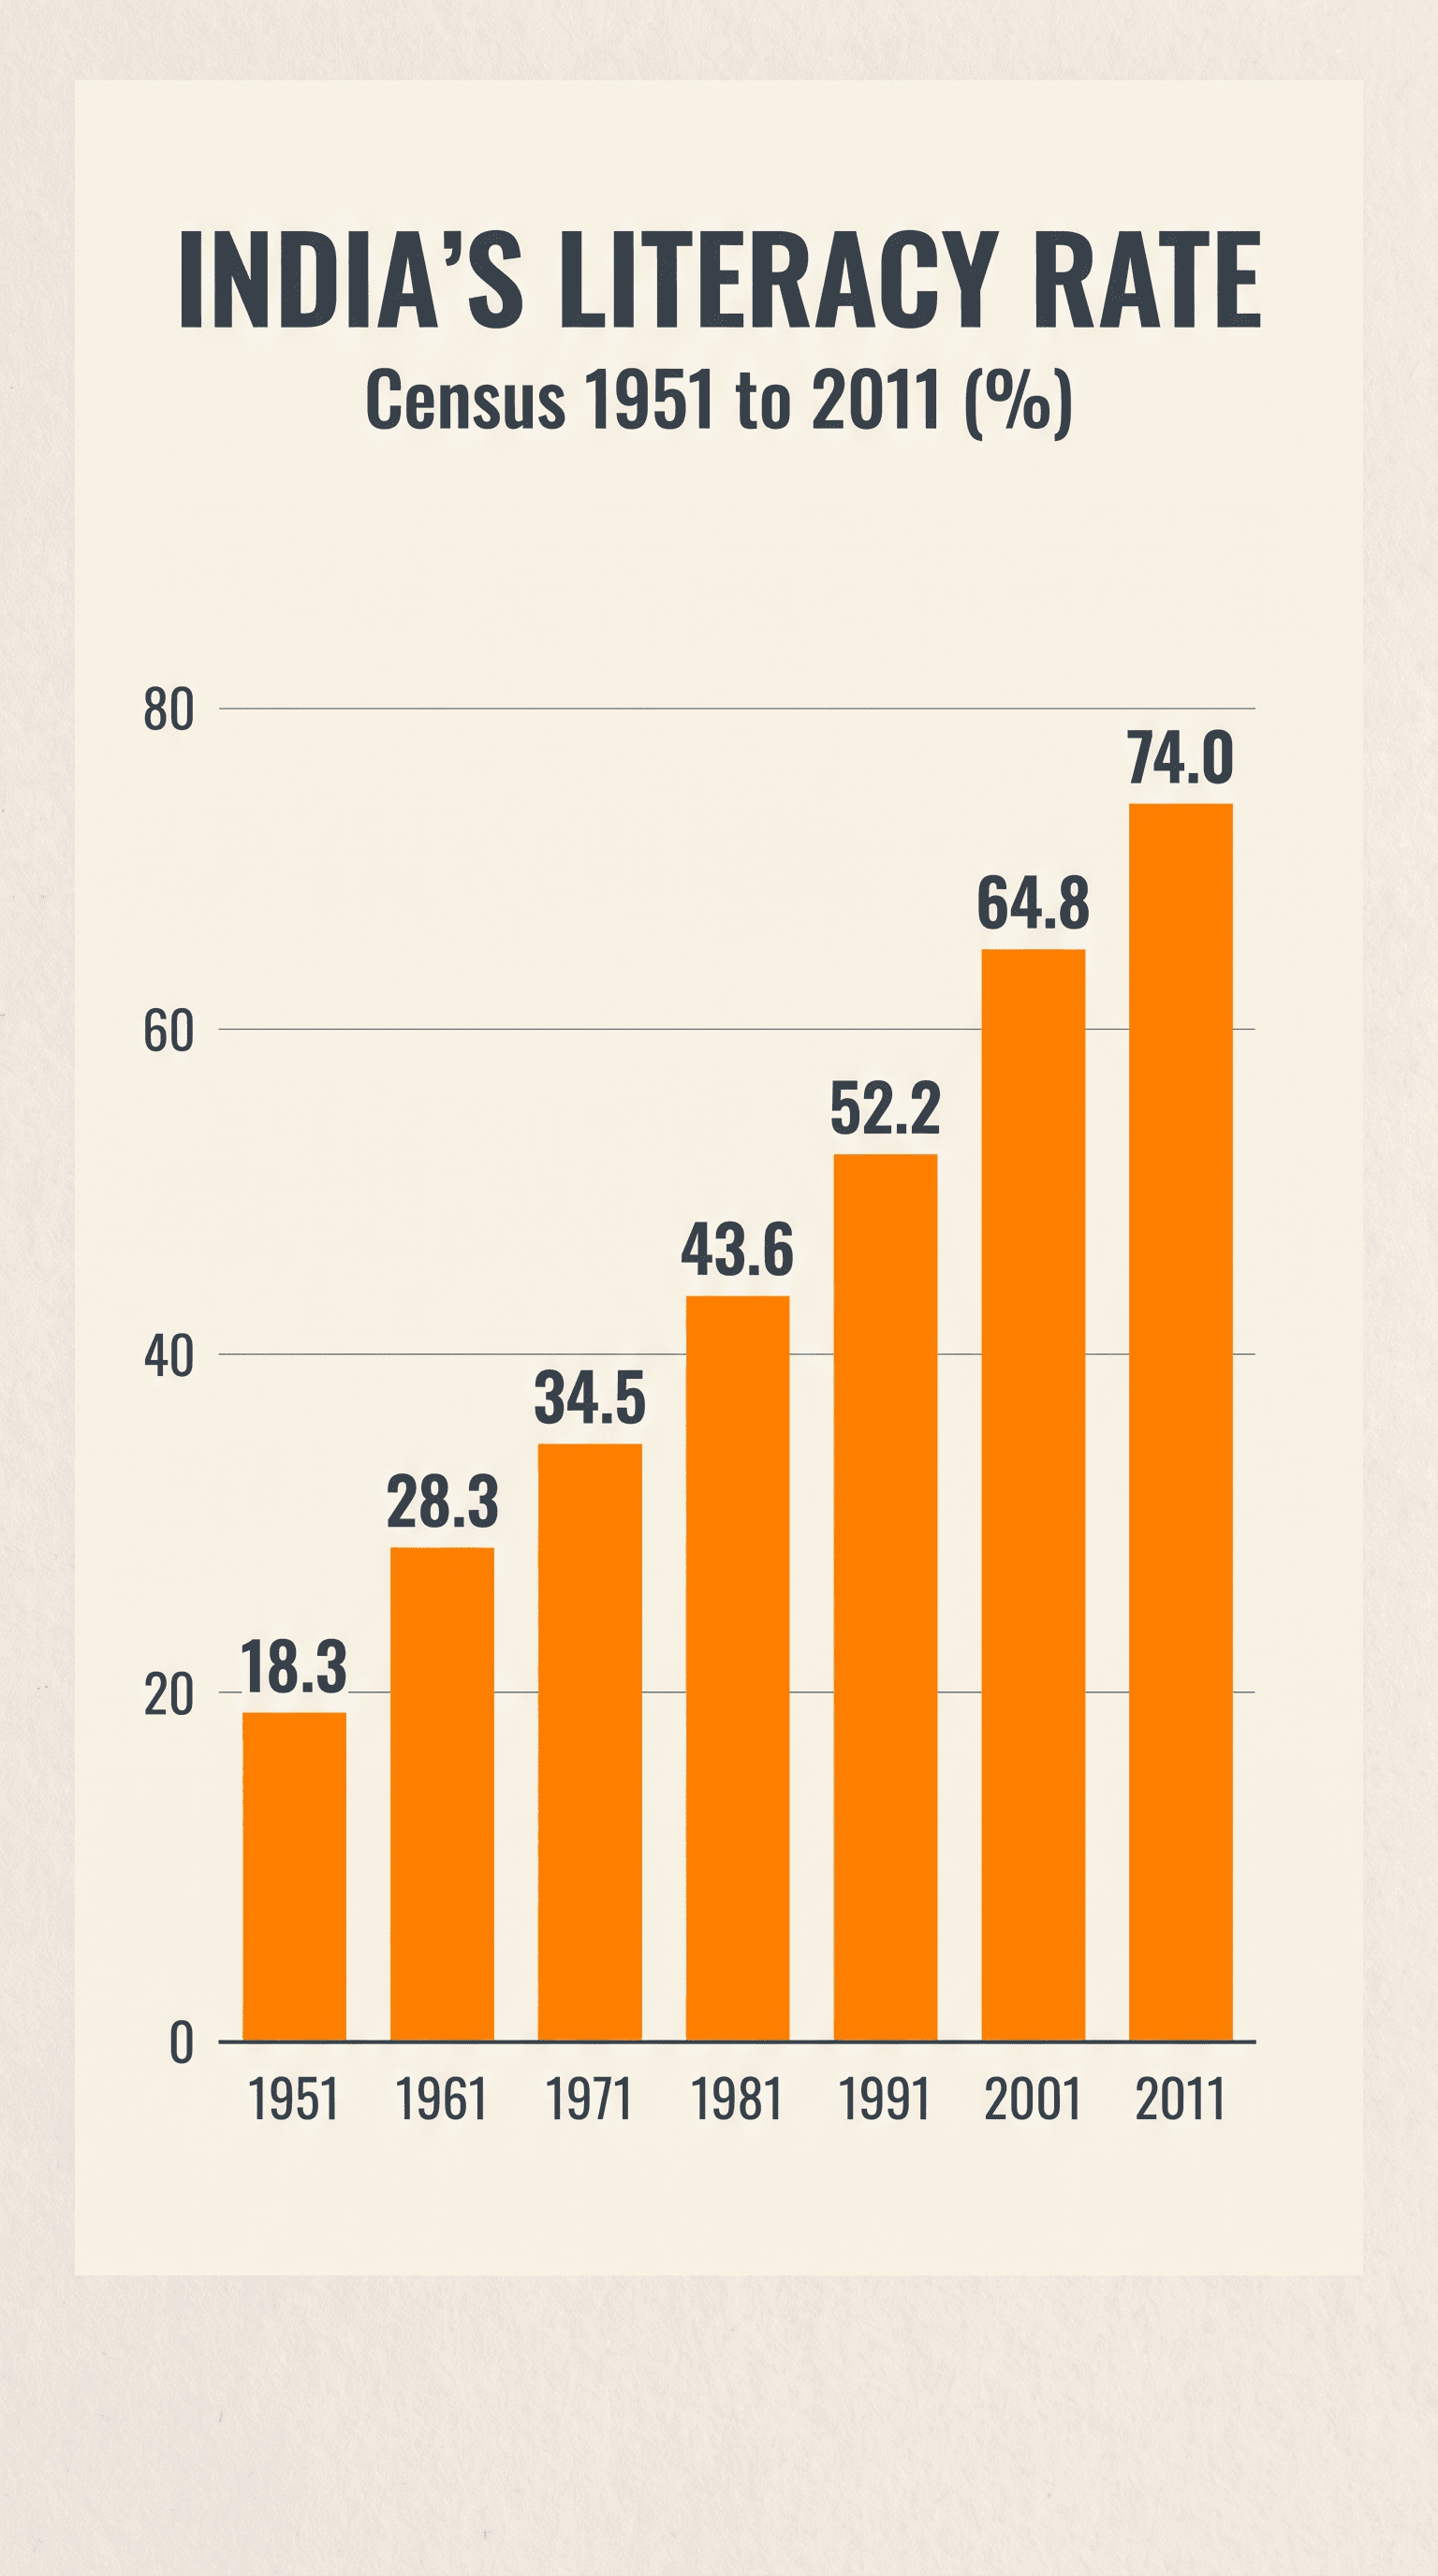
Each bar sits at its value on the axis.
Turn a title and your numbers into a vertical animated bar chart video, drawn to scale with exact values. Made with Nano Banana Pro and Gemini Omni 1.2 Flash.
Your generated content will appear here
Example
One run with seven Census values. The bars grow in order and the video lands on the finished chart.
Chart Video
Chart Image
About this Pixelflow
Animated Chart Video from Your Numbers turns a title and a list of values into an 8-second vertical chart video. The finished chart is drawn first with every value to scale, then the bars grow into place one by one with their values, and the video ends on that exact chart. You also get the chart as an image. Made with Nano Banana Pro, Gemini 3.8 Flash and Gemini Omni 1.2 Flash.
Write them as label and value pairs, such as 1951: 18.3.
Gemini 3.8 Flash designs it, and Nano Banana Pro draws the finished chart and an empty version of it.
Gemini Omni 1.2 Flash animates from the empty chart to the finished one.
You give
You get
The last frame is a finished chart, so the numbers you post are the numbers you gave.
Each bar sits at its value on the axis.
Bars grow in order and each value pops in as its bar arrives.
The finished chart comes back as an image for posts and slides.
Two files per run.
Vertical 9:16 MP4 with sound, 8 seconds, 720p.
The finished chart as a PNG.
Gemini Omni 1.2 Flash makes the video, Nano Banana Pro the frames and Gemini 3.8 Flash writes the prompt.
Turn a statistic into a vertical video people watch to the end.
Add a moving chart to a launch, a result or a survey.
Show a trend over time in a few seconds.
Building with it? Read the Animated Chart Video from Your Numbers API docs.
Up to eight. With more, the eight most recent are used.
Yes. The finished chart is drawn first with each bar at its value, and the video ends on that exact frame. A value label can flicker for a moment while the bars grow, so watch the clip before you post.
Bars for categories or years, a line for a long trend or a donut for shares of a whole, picked to fit your data.
Yes. It runs through the Pixelflow API with the same inputs: submit a run, then poll for the result.
Call it from your code with the same inputs you used here, or talk to us about running it at volume. Segmind is an authorised channel partner of ElevenLabs, Google, ByteDance, Alibaba, OpenAI, Kling and 40+ more AI providers.